 Detail
Prodigy
SpecsLab Prodigy is a data acquisition and experiment control software package which sets a new standard in electron spectroscopy. The modular software concept allows multi-dimensional data handling, fully integrated with optional remote device controls and experiment automation.
Nowadays, materials research requires performance, and handling far beyond more data acquisition. SpecsLab Prodigy offers a modular, integrated acquisition and automation package for scientific tasks with stunning new handling concept. This includes angle resolved photoemission spectroscopy, chemical mapping of surfaces, automation of experiments by integration of different experimental techniques and sample treatments. The software consists of a Base Package for the spectrometer control part; experiment automation modules for acquisition automation by remote device control.
Find the download of the latest version at the bottom of this page.
Aside from the standard devices for spectrum acquisition SpecsLab Prodigy can control more than 50 external devices out-of-the-box. Additionally it offers configurable and programmable generic interfaces to support even more devices for a seemless integration into the customer's environment.
Consequently, the SpecsLab Prodigy software is an indispensable tool for multi-parameter data acquisition and automated experiment control. The results can be achieved rapidly and postprocessing routines help to customize studies while guaranteeing comparable results through standard workflows and batch processing.
The basic functionality can be extended with the following optional modules (see related products below)
- Vacuum Control
- Quantification and Reporting
- Advanced Automation
- Remote In
- Remote Out
- Data Logging
Usually a new minor version is released every month with bugfix updates in between as required.
Three Clicks to Acquire a Survey Spectrum
Recording an XPS survey spectrum takes only three mouse clicks, because pre-defined templates simplify the work flows for every level of user experience.
All templates can be customized and extended with automation commands for sample movements, sputter cycles, heating treatments, gas flows, or other things. Spectra can be measured in different scan modes („Fixed Analyzer Transmission“, „Snapshot“, „Fixed Energy“, „Constant Initial State“, „Constant Final State“ and „Fixed Retarding Ratio“) depending on the application, like XPS, UPS, ISS, AES, or ARPES.
Furthermore, spectra can repeatedly be acquired during optimization by the user until the sample position, other experimental parameters, or device settings have reached optimal conditions.
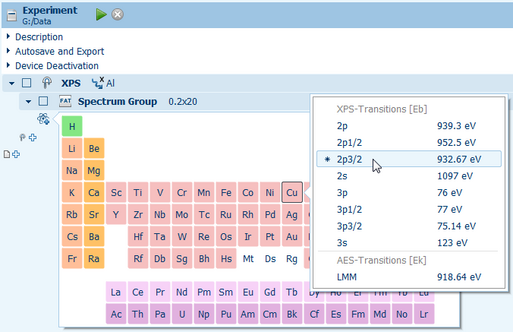
To simplify the setup of the measurements the integrated periodic table of chemical elements gives access to a database with pre-defined regions for core level excitations of all elements. The most sensitive transitions are marked with an asterisk to support operators during the analysis of unknown samples.
The entries in the databases can be customized and extended to account for special elemental combinations like alloys or carbon-based materials which have material specific values deviating from the standard references. The integrated help system, tooltips for buttons and input fields further support novice users in getting familiar with the software.
Creating Automated Experiments
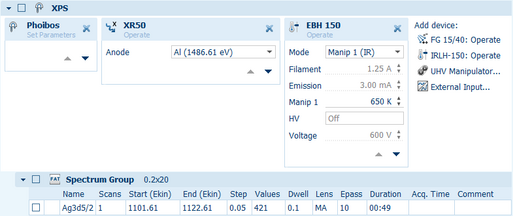
SpecsLab Prodigy puts a strong emphasis on experiment automation: The Experiment Editor gives control over the experiment beyond the standard data acquisition towards an automation of the full experiment. This includes sample heating, sputter and annealing cycles, changing sample position and orientation, or controlling pressure and gas mixtures in near-ambient pressure experiments.
To control the experiment the user can select specific settings, modify parameters and create batch-measurements. For remote access many SPECS devices and components can be operated via the software saving the user time to handle the experimental set-up. This includes automated sample positioning by stepping motors and automated adjustment of flood gun parameters for optimum charge compensation. Data provided by these remote controlled devices can be recorded synchronized with the spectrum acquisition.
Entire experiments or parts thereof can be saved as templates to easily create new procedures out of these building blocks.
In the basic version some simple automation features are included. More are available with the optional Automation Module.
Besides the repetition of a part of an experiment for a number of times ("Loop") other functions like "Pause" or "Sleep" are available. Those are necessary for notifications of breaks which have to be taken to perform modifications on the experiment, for example.
The "Wait For" command allows delaying the experiment execution at steps in the experiment for which the specified condition is essential to proceed. This condition works for any read-out parameter from a remote controlled device and can be tested with the standard mathematical comparison operations. This is useful, among other applications, to wait until the sample is heated above a certain threshold or cooled down after heating cycles. Or the experiment can wait for voltages/currents to reach certain values to synchronize with external devices.
Devices which are not remotely controllable can be included in an experiment as generic "Dummy" devices. The user can choose to be prompted during plan execution for setting the configured parameters (e. g. source parameters or manipulator positions) before continuing with the experiment.
To process the recorded data an auto-export feature is included which can write Igor, VAMAS, xy, SpecsLab2, PDF and docx files (the latter two only with the Reporting module). Those files can include the data of the complete experiment or each spectrum separately. The latter is updated while the acquisition is still running.
Direct Access to Remote Controlled Devices
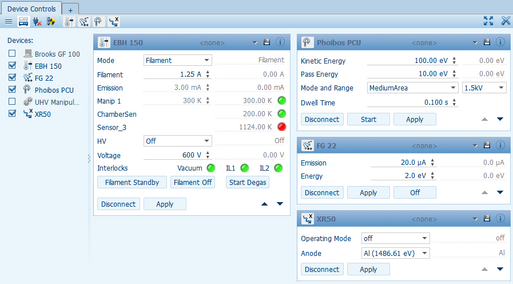
Device Controls gives immediate access to all changeable parameters of the remote controlled devices. To monitor and diagnose a system many read-outs show the present state. Changes occurring to the system can be logged over time for later analysis with the optional Data Logging module.
To keep a clear overview the reported parameters are arranged in several levels of priority and can be viewed anytime when needed.
Examining the recorded data
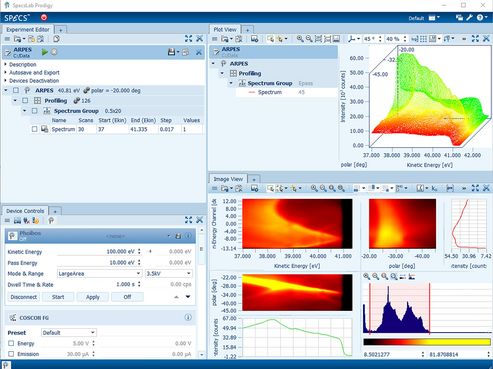
The Plot View window shows the acquired raw spectrum data and additionally recorded data sets which can be processed by applying mathematical operations (like computing the peak areas, multi-peak fitting, full width half maximum, and signal-to-noise ratio). Aside from the integrated signal of a multi-channel detector, data for each scan and channel can be analyzed separately.
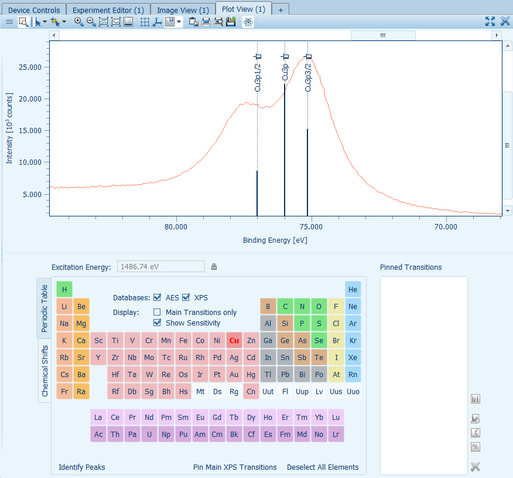
Automatic peak identifications based on the periodic table of elements make a direct detection easy and fast.
Peak fits can be applied to the data as well as full quantification operations based on multiple spectra. The resulting datasets can be exported to files or the clipboard to be able to include them into separate reports.
All those operations are part of the experimental procedure. That means that when spectra are repeatedly measured, the operations are automatically reapplied and the results are updated.
The bottom line is that all automation and scripting features allow the user to create experiments from the initial data acquisition to data evaluations for quick screenings and overviews which help to judge quality of data and give initial results.
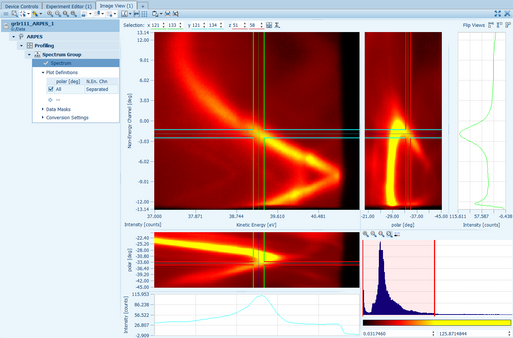
In the case of 2-dimensional detectors the Image View presents the actual intensities with a false color picture to reveal important details. It is also possible to display data from multi-dimensional recordings by specifying the excess dimensions.
For multi-dimensional recordings (for example, manipulator movements along two axes) operations can be applied automatically for each position. The output values of those operations can be plotted against the coordinates to display images such as chemical maps.
