ISQAR
ISQAR in SpecsLab Prodigy is a quantification feature for XPS data which allows for reliable quantification of the chemical composition of sample surfaces, multipeak identification by curve fitting and calculation of angle profiles or sputter depth profiles.

The ISQAR module of SpecsLab Prodigy is completely integrated into the data acquisition package. It allows for precise determination of relative quantities of each element in selected peak areas of the photoelectron spectrum. All technical parameters, like transmission functions, lens modes, geometrical parameters and X-ray source settings are considered during the quantification. ISQAR is designed for easy handling. It is comprehensive with respect to models, features and parameter settings. It provides a basis quantification for element identification and chemical composition, an advanced quantification for database choices and multipeak curve fitting and reporting option for design and export of graphics for publication purposes.
Basic Quantification: Element Identification and Chemical Composition
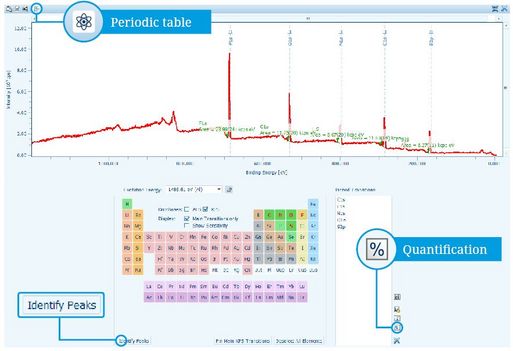
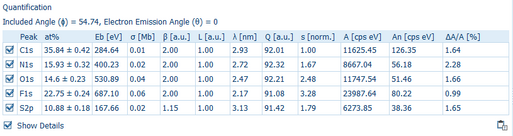
By using templates and proven databases, the user gets an initial set of useful quantification results in only a few quick steps. As part of the quantification procedure, Prodigy’s ISQAR module automatically performs peak area operation on the selected peaks. Afterwards the quantification operation is performed on the group of selected spectra. For the very first quantification of elements in an unknown sample the respective spectrum in the Plot View Data Browser is selected and the periodic table is activated. Then you use the Identify Peaks button to automatically find and display excitations that match the peaks in the selected spectrum. Choose the peaks that you want to use for quantification either by selection of the spectra or the transitions of the element in the periodic table. Starting the procedure will finally calculate the area of the selected peaks and add a quantification section to the browser. The results of the quantification are shown in a table at the bottom of the quantification section. By default, only the peaks and the calculated atomic percentages are shown. Further details can be added into the table or become visible as mouse-over information in the tooltip. In particular, the tooltip discloses the database, model and interpolation used for the quantification.
Advanced Quantification: Database choices and Multipeak Curve Fitting
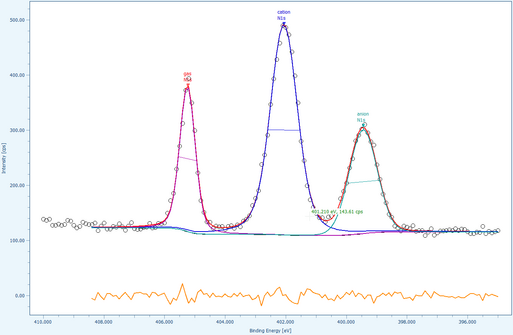
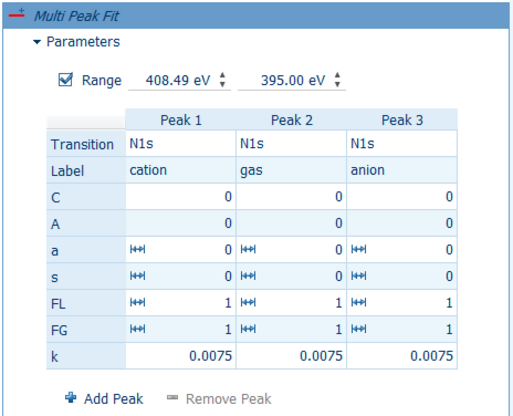
For a more sophisticated analysis there are many ways to refine the procedure and improve the quantification, for instance by variations of the Inelastic Mean Free Path (IMFP) calculation method, background subtraction methods and numerical separation of overlapping peaks by using a multipeak curve fit routine. Advanced users can refine all integrated databases easily by extension or addition with user databases to properly reflect material specific properties deviating from the standard references given in literature. Also XPS data intentionally taken at different emission angles can be used for quantification by taking into account the actual measurement geometry.
Reporting

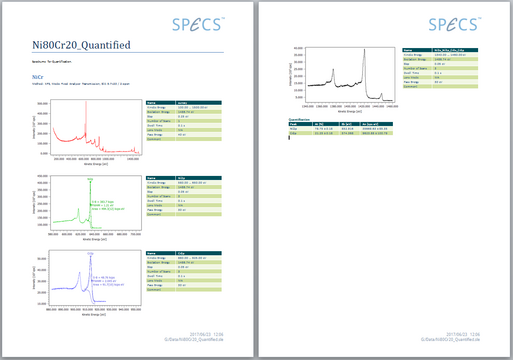
The result of the quantification can be exported as data or complete documents with text and graphics as PDF or docx-file which can be opened with standard office software. Those reports can be customized to select the displayed textual and graphical information, and can easily be configured to match a corporate design. The customization is performed inside the office document template through bookmarks and placeholders.