
Optimized user experience

The software design has been optimized for more efficient workflow, resulting in a streamlined and simpler design compared to previous generations. With software-based instruments becoming more and more of a standard, the software departs from its hardware ties and makes any user feel at home quicker thanks to its modern, yet timeless design.
128 Live Signals
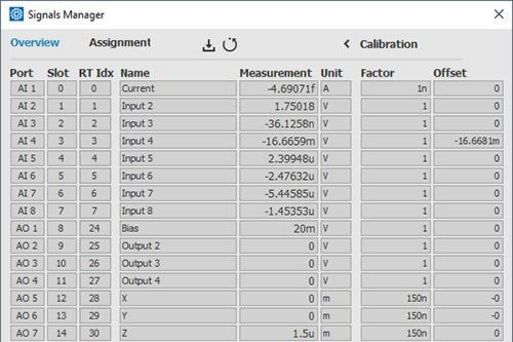
128 signals: Up to 24 Inputs, up to 40 outputs plus internal signals for a total of 128 signals, 24 of which are seamlessly accessible throughout the entire Nanonis software. Any signal can be selected in any module for feedback, spectroscopy or noise analysis. The distinction between inputs and outputs is blurred to provide a more powerful experimental platform. All operations between signals are performed in the digital domain with intuitive software-control without the drawbacks of analog signal processing. Signals are displayed in physical units using a floating point representation with assigned SI units for immediate quantitative results. Up to 24 signals can be streamed directly to disk at full real-time speed, and for even higher time resolution, up to 8 signals at the ADC sampling rate of 1 MS/s can be streamed. So, acquiring a large number of simultaneous signals at a high rate is now possible.
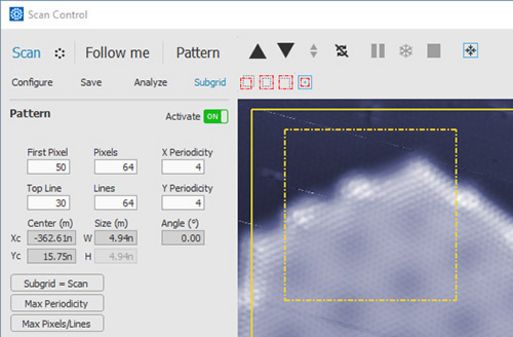
Interactive scan control

Three modes are integrated in this module: 'Scan', 'Follow-me' and 'Spectroscopy'. All scan parameters can be adjusted on-the-fly without delay during scanning, and it is possible to zoom, navigate and paste multiple scanned images to the background for reference. Any of the 24 signals can be displayed in multiple windows. Pause then resume scan with no data loss after tip cleaning, spectroscopy, or manipulation. The motion of the tip is visualized in real-time when scanning or positioning with the mouse.
New to the BP5e is a fast scan mode with a pixel rate of up to 1 million pixels per second, allowing significantly faster scanning or acuiring very high resolution images in a short time. For example, if two channels are recorded such as Z and Current with a pixel density of 512x512 a frame rate of 2 frames/second can be achieved. Data of up to 8 channels can be streamed directly to disk at up to 1 MS/s, with the only limitation being the capacity of the hard drive.
Multipass scanning

Scan control supports multipass scanning, where a single line can be scanned multiple times with different parameters for each trip over the surface. For each pass, bias and feedback setpoint can be changed. Furthermore it is possible to record a channel, e.g. topography, and then play it back in the following path - a typical MFM application. For complete freedom and flexibility the user can call a homegrown LabVIEW program to change all settings after each pass, or combine MultipPass with scripting functions to allow very fast execution of experiments.
2D- and 3D-spectroscopy
Advanced spectroscopy modules allow for experiments at a single point, along a line, a cloud of arbitrary points or a regularly spaced grid, including combined grid and scanning mode that can have different pixel densities. All pattern types can run scripted spectroscopy.
- Fast spectroscopy module with up to 1'000'000 pixel/s, fully adjustable timing parameters, access to any output signal and option to run in time spectroscopy mode
- Z-spectroscopy with user-defined retract condition. Dual-setpoint retract condition for Z-spectroscopy on molecules.
- Bias spectroscopy with up to 20’000 pixels/s, variable bias point spacing and 7 timing parameters available before, during and after the spectroscopy sweep. Fast synchronization with external instruments at each point using TTL trigger lines is also possible
- Generic sweeper: sweep one of 13 possible signals (8 physical outputs and 5 internally calculated) while recording any other channels.
- Fast custom experiments with real-time scripting
- Custom experiments programmed in the Programming Interface
SafeTip™

SafeTip™ takes care of retracting the tip instantaneously should a potentially harmful event be detected. The function is not only very fast, but also highly configurable and offers a variety of options to limit time loss and empasize safety for the tip.
- The SafeTip™ signal can be different than the feedback signal. For example excitation when controlling on frequency shift
- Any signal or calculated signal can be used for SafeTip™
- Several options are available once SafeTip™ engages: Keep tip retracted or release after a certain time, continue the scan after a certain wait time, pause the scan
- Withdraw target position can be specified and optimized to reduce piezo creep
- Z-motor can be automatically engaged to withdraw the tip farther . For example when SafeTip™ is working on a temperature signal
Spectrum analyzer, graphs and oscilloscopes

- Dual channel oscilloscope with post- and pre-trigger
- Spectrum analyzer: continuous display of any of the 128 channels in the frequency domain
- Signal charts and history: rolling charts for continuous data monitoring and acquisition
- Long term spectrum: record data over hours or days to discriminate environmental effects from the microscope measurements.
All analyzers, graphs and oscilloscopes are completely independent and can run at the same time as image scans and spectroscopy allowing the same channels to be acquired in both time and frequency domain as well as in a conventional manner simultaneously.
Real-time mathematical operations between channels

All 128 internal signals are available for calculations, and the calculated signals are accessible to all software modules. At the same time, all calculated signals can also be routed to any of the analog outputs.
- Available calculations: +,-,*,/,log,offset, and combinations thereof
- Parallel ramping of multiple signals with scaling factors and offsets
- Z-Feedback on calculated signals is possible
Direct access to external instruments

Remote control of a variety of preamplifiers including the Nanonis MCVA5, all Femto® variable gain amplifiers, the Basel Precision Instruments SP983c and the Pluto Instruments PCG-380F-R is possible. Gain control is accessible directly from the user inputs module and through an additional preamplifier control module in the case of the MCVA5. As standard within the Nanonis software, all calibrations are adjusted according to the configured gain, ensuring that data are acquired with the correct absolute value and do not require gain compensation in post-processing.Two DIO ports of the RC5 and RC5e can be used for remote control, as long as they are not used for other purposes. With the Nanonis MCVA5 that allows up to 8 channels of preamplification.
The External Devices module allows control and readout of up to 4 parameters from other external instruments (magnet power supplies, AWGs, RF sources, lasers, temperature controllers, etc.), as long as these have LabVIEW drivers. The Programming Interface add-on module is not required.
- Up to 4 input and 4 output instruments or parameters of the same instrument
- Sweep instruments and acquire data with the generic sweeper
- Display live data in the long-term chart
- Extremely simple driver configuration in LabVIEW
Open file formats

The Nanonis file format (.sxm) for scan images, binary file format (.3ds) for experiment on a grid and ASCII file format for simple experiments are described in detail in the contextual help. Most processing software such as SPIP, Mountains, Gwyddion, WSxM and open Nanonis files. The file header can be read directly in Notepad++. Matlab, Python, and LabVIEW routines are provided for customized postprocessing.